Creating cross connected charts
In this tutorial, we will learn how Muze establishes cross interactivity and how we can create multiple charts and show cross interactivity between them.
How cross interactivity is established in Muze?
In most visualization libraries, interaction is established by binding an event to a DOM element and executing a set of functions on the dataset associated with that element. While this establishes event interaction, but trying to achieve the same functionality dynamically (for instance, through an API or some other external event) is quite difficult and sometimes nearly unachievable.
Muze follows a data driven interaction model . This means that any interaction in Muze occurs due to the data bound to it and not the element itself. Hence, any interaction can be triggered in Muze irrespective of the source of the trigger.
All the DataModel instances derived from the same data source are cross connected. Now if you use these DataModel instances in your chart, you can have cross interactivity between them. Muze acheives this cross interactivity using Data Propagation. When you interact on a plot, the identifiers / dimensional values of the plot are propagated to the other data models. Any canvas using that DataModel will now be notified with the identifiers which are propagated and the resulting DataModel instance created from that.
Let's see an example, where we enable this cross interactivity.
Create multiple canvases sharing the same data source
Let's create a DataModel instance using the cars data:
const data = await loadData("cars.json");
const schema = await loadData("cars-schema.json");

const formattedData = await DataModel.loadData(data, schema);
const dm = new DataModel(formattedData);
Now, we will create two filtered datamodels by Maker as ford and chevrolet
const ford = dm.select({
  field: "Maker",
  value: "ford",
  operator: "eq",
});

const chevrolet = dm.select({
  field: "Maker",
  value: "chevrolet",
  operator: "eq",
});
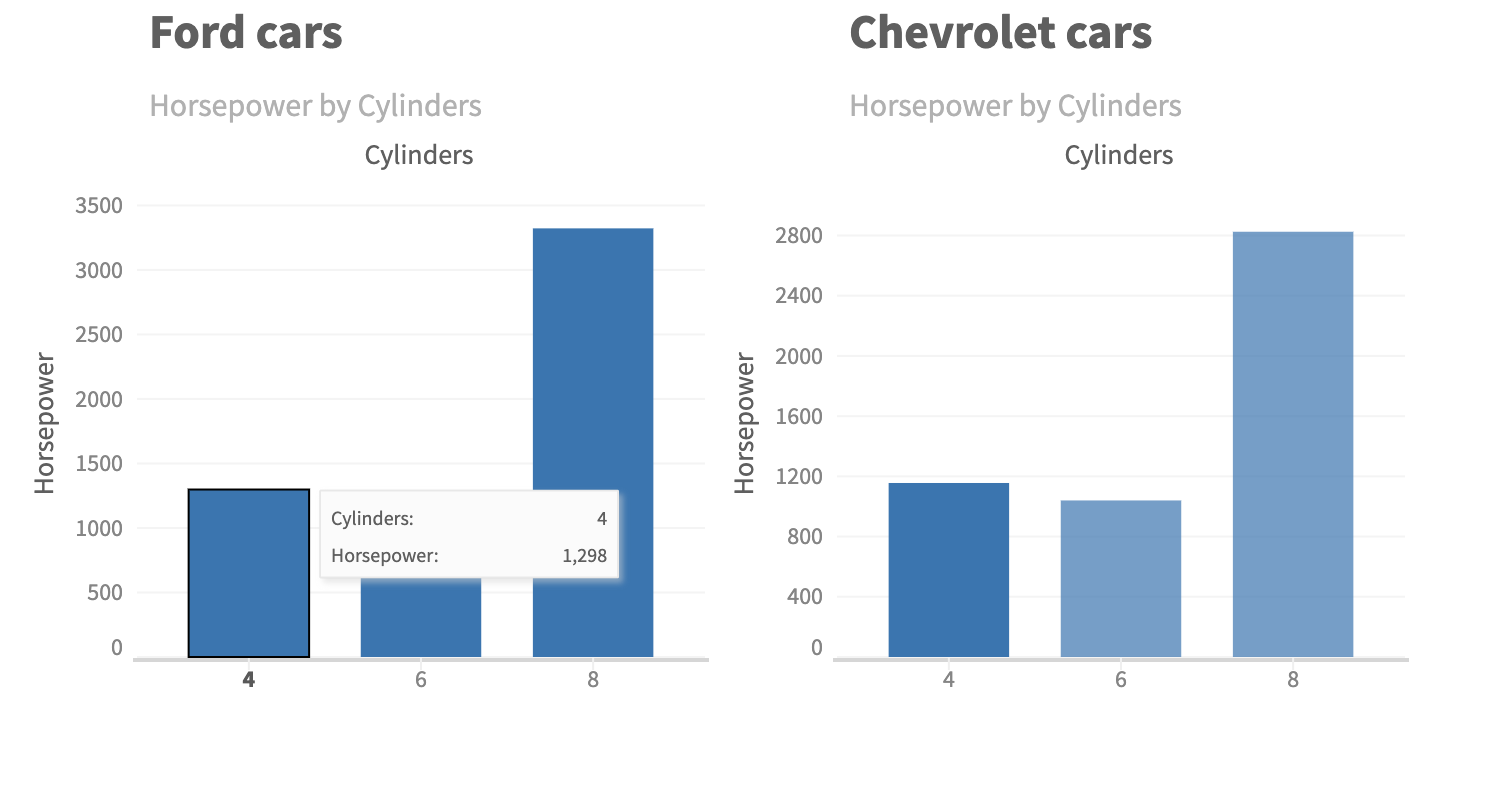
Now let's create two charts using these two datamodels.
First we will create a canvas instance and set the rows and columns and pass the DataModel to each canvas:
canvas1 = muze
  .canvas()
  .rows(["Horsepower"])
  .columns(["Cylinders"])
  .title("Ford cars")
  .subtitle("Horsepower by Cylinders")
  .data(ford)
  .height(350)
  .mount("#chart1");

canvas2 = muze
  .canvas()
  .rows(["Horsepower"])
  .columns(["Cylinders"])
  .title("Chevrolet cars")
  .subtitle("Horsepower by Cylinders")
  .data(chevrolet)
  .height(350)
  .mount("#chart2");
Now, let's use the Muze ActionModel API to enable cross interactivity between the charts. ActionModel API is used for enabling cross interactivity between different canvases and registering interactions on them.
This code enables cross interactivity between the two canvases:
muze.ActionModel.for(canvas1, canvas2).enableCrossInteractivity();
When we call this API, Muze automatically enables default interactions like highlighting, tooltip, brushing and linking between them.
Example
const { muze, getDataFromSearchQuery } = viz;

const data = getDataFromSearchQuery();

const canvas1 = muze.canvas();
const canvas2 = muze.canvas();
const ActionModel = muze.ActionModel;

const ford = data.select({
  field: "Maker",
  value: "ford",
  operator: "eq",
});

const chevrolet = data.select({
  field: "Maker",
  value: "chevrolet",
  operator: "eq",
});

canvas1
  .rows(["Horsepower"])
  .columns(["Cylinders"])
  .title("Ford cars")
  .subtitle("Horsepower by Cylinders")
  .data(ford)
  .width(350)
  .height(350)
  .mount("#chart1");

canvas2
  .rows(["Horsepower"])
  .columns(["Cylinders"])
  .title("Chevrolet cars")
  .subtitle("Horsepower by Cylinders")
  .data(chevrolet)
  .width(350)
  .height(350)
  .mount("#chart2");

// Enable cross interactivity between the canvases
ActionModel.for(canvas1, canvas2).enableCrossInteractivity();